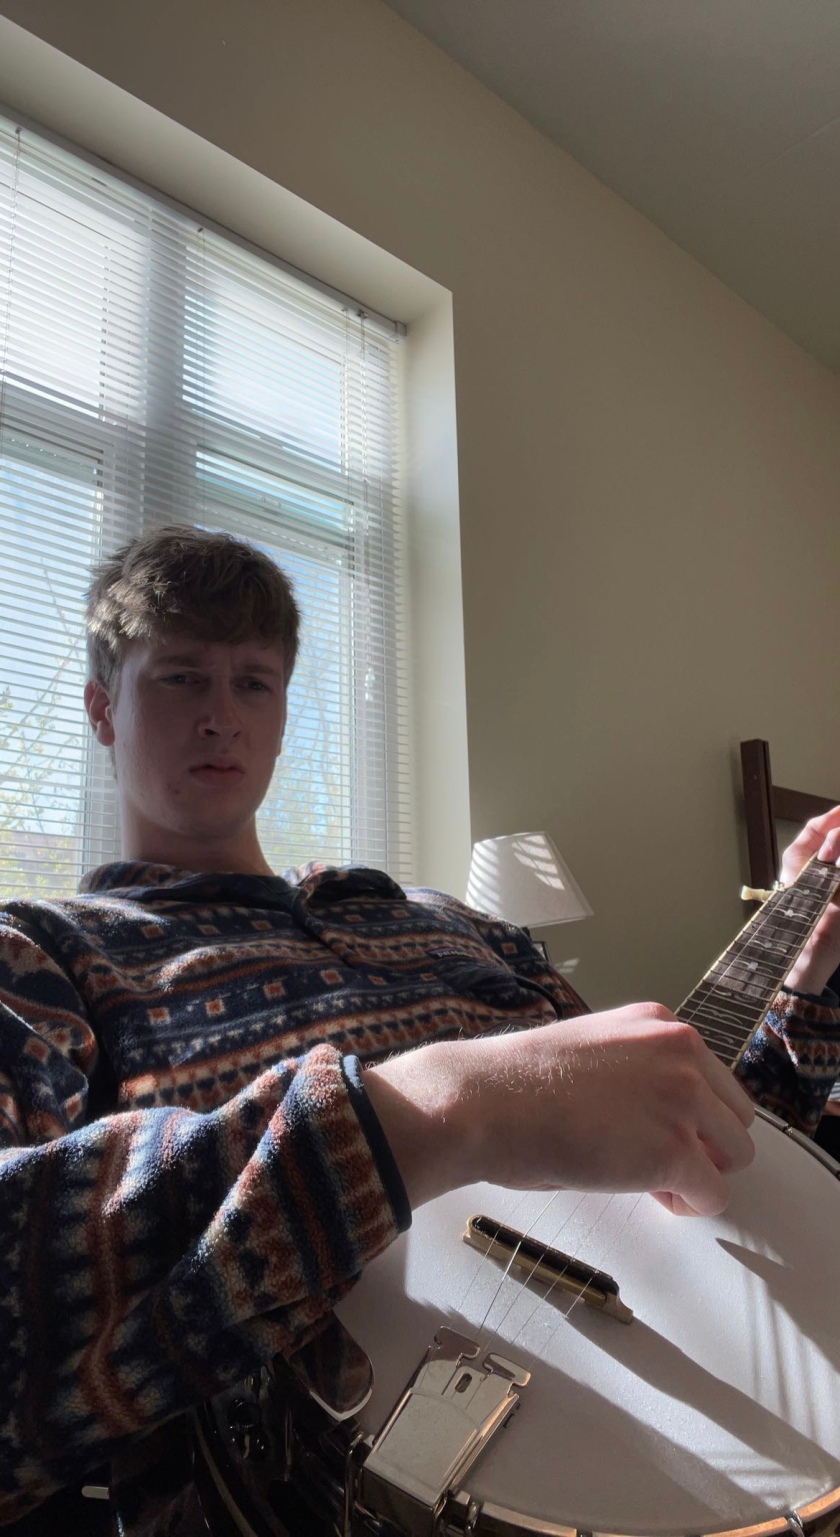
I chose to recreate the iconic dueling banjos scene from deliverance for one very simple reason: I had a banjo handy. All I had to do was dawn a brown(ish) top, accurately recreate the character’s facial expression, and take the photo from the right angle. I am pleased with how it turned out.
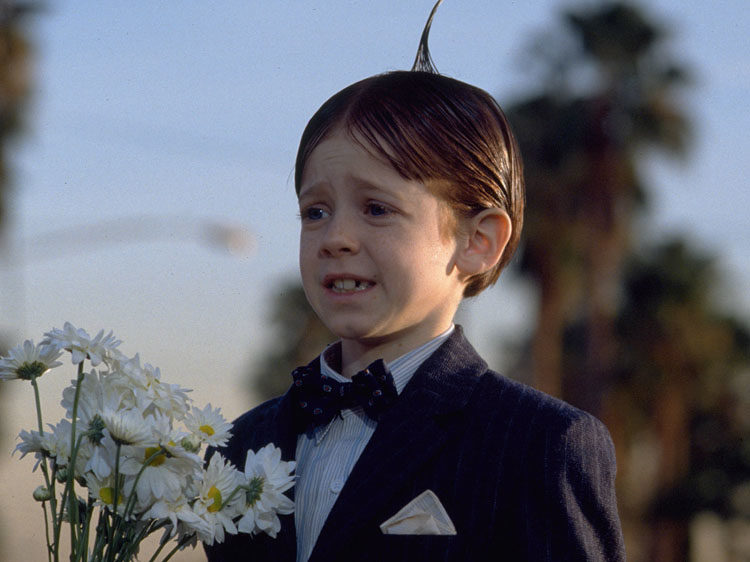
I think this assignment was fairly easy. Although, I did have trouble finding a movie scene that was easy enough to recreate. But I did come across this alfalfa scene, where he’s planning on going on his date with Darla. I think for the most part I did good. I would say that the angle and face are not matching completely.
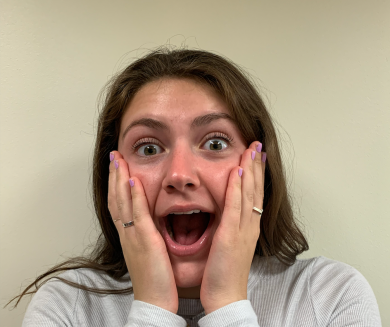
Although this is not a perfect match, I love this scene in Home Alone when Kevin screams. I somehow do not own a red shirt and I could not get the facial expression quite right. I found this assignment to be very fun and in a way challenging. There were so many different scenes from different movies that I could have chosen, but I liked this one the best.
For this scene recreation, I found the scene I wanted first, and worked from that with what I had access to in the room I was in. I thought these two images would be good due to the comedic effect of any recreation that wasn’t literally a golden artifact being used instead. For nailing this scene, I flipped the photo editing to be flipped so it matched the original, and tried to achieve a successful depth of field, for which I put a similar colored upside down mug atop as the platform for the “artifact”. I thought seeing the behind of a bear honey bottle was perfect, as it was a recognizable front that was unseen in the shot, similar to the Indiana Jones one. Additionally, both shared a unique golden color, as well as a very similarly imprinted texture throughout.
I started off by going on Canva and setting up my comic into 4 panels. Then I came up with the idea of what my comic would be about and came up with friends doing a hair experiment and it turns out to be a disaster. There wasn’t much challenging about this comic accept for having to set up all the images into one panel. It wasn’t much different from the triptych because they both had the same idea of having a beginning, conflict and end. Having to stretch the middle was different because I had to elaborate on the story so it extended into 4 panels. I choose to tell this story because I thought of hair horror stories where people go in and show the stylist a picture of the style they want and end up with a completely different outcome.
I chose to track my productivity. I used the categories: hrs spent on phone, motivation, naps, stress, hrs spent on academic work. I chose these as categories because they all affect how productive I can be. The question I was hoping to answer was: what has a greater influence on my productivity?
Based on my data, I tend to be unproductive on Fri-Sun. I think the main factor for this would be due to the fact that I do not have classes I need to attend, besides one. I do tend to get distracted a lot more on these days than on the weekdays. Another thing I noticed was that I do spend a lot of time on my phone than I would like. The longest time was around 6 hours. I hope to work on this habit. Although, I did think that the hours would’ve been a lot higher.
To answer the question, factor that has the most influence on me would be how motivated I was. This makes sense, because if I have to force myself to do something, it would be easy to distract myself by using my phone. I noticed it really influenced most of my other categories like stress.
If I were to continue this, I would focus on something other than my productivity. I would like to do something a lot more deeper, maybe something dealing with mental health related. I think that I could have taken this assignment a lot more seriously, maybe I would have learned something a lot more useful.
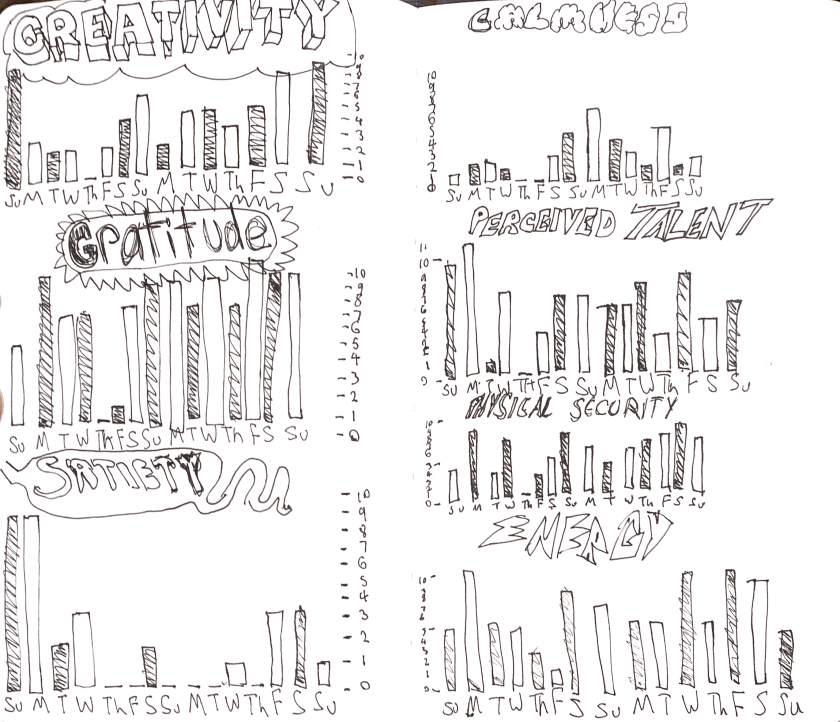
For this assignment, I really tried to find qualities in my life that are important enough for me to contribute to my happiness. If one area is lacking, for example, it would appear that one of these quantified traits would either be the cause or effect related. I ranked two full weeks day by day, three Sundays, into a 1-10 format. In doing this, I felt it captured my complicated aspects of what it means to be happy. I found creativity to be an important aspect of my creativity. For example, if I was feeling really creative and inspired, I would feel self worth and accomplished. On average, it appeared that the days where I felt most creative coincided with days where the other traits were high, thus appearing to be a good attribute or sign of happiness or positive brain processes. It also appeared that the creativity was in relatively uncommon/ short supply, not often brought out to the fullest. Gratitude was a fairly interesting one, as overall, I felt extremely happy these past two weeks, and I found this was the most profound or clear cut cause and effect reason for my good mood: I had so much to be grateful for, and reminding myself and being aware of that every day contributed to my overall happiness. The days where there was extreme dips in gratitude were some of the more upsetting days, but quickly a change of perspective kept my spirits up. Satiety is an incomplete goal to this day of measuring my happiness. As although I felt happy these past weeks, I couldn’t get a hold of my satiety: I always felt hungry and consistently held patterns of overeating. Keeping this in control would help me to feel as though I had control over myself and my feelings and was a good indicator of complete happiness in days where it was high. This is something that I would continue to measure if I had more time and find very insurmountable to self improvement, in addition to gratitude. I found that I almost never had an inner calmness in me these past two weeks, something that proves that to me, being all that calm isn’t a completely necessary indicator of happiness. Having a bit of stress to keep me going I found worked best for me: being overly calm seemed to be a sense of ignorance that isn’t realistic. My perceived talent is also semi related to gratitude: if I felt I had talent and self worth on a given day, I would be this grateful and happy. Perceived talent was also a great indicator in that it was indicative of the fact that I accomplished various tasks on these days and had done so in a manner that had given me something to feel talented for. Physical security is a semi shallow yet meaningful aspect to my overall happiness: if I was confident in my body, I would thus be confident and happier overall. My eating habits and satiety can sometimes interfere with this, and on days where my fullness was especially low, it wasn’t uncommon that I would also feel less secure in my body as a result of my eating habits. Overall, however, this data also proved that I general was secure and confident in my body, thus a good indicator of happiness. Being reflective of my energy was very interesting for me, as over these past two weeks, I have been super energized more than normal, thus proving to be a good indicator as well of happiness. Overall, I thoroughly enjoyed and found it profoundly beneficial to checking in on myself on a daily basis in the fields that felt significant for me and my perceived happiness. Although there was a limited sample size, I think doing this assignment whether coincidence or circumstantial did in fact coincide with my overall elevated perception of happiness. Whether I explicitly record data and keep this up or not, to keep an overall pattern of self reflection is a good way to know if I am happy, as well as improve my life in certain fields if I see one of these traits is lacking. Thus, if one area is lacking, ir might be a good self diagnosis as to contributing to my feelings of diminished wellbeing.
For the data visualization activity I decided to measure my productivity levels while listening to different genres of music. I decided to rate my feelings on the questions I wrote before tracking the data on a scale of 1-10, one being very little agreement and 10 being a strong level of agreement. When creating the chart I took the averages of each answer to the question and created a bar graph. I believe that I was able to answer my original question of which genre of music was the most effective in helping my productivity levels. I was able to conclude that when doing work and listening to music, it helps if I enjoy the type that I am listening to. When I did not know the words or the artist of a song, I felt that I was more distracted and fixated on trying to listen and see if I liked the song. I was able to conclude that I work best when listening to R&B music. Also, I realized for some types of work such as reading a textbook or an article, it was harder to process the words I was reading as I was listening. Hearing something while reading another thing hindered my ability to effectively complete my homework.
I decided to visualize my data in this way because I have always tried to change up what type of music I listen to while doing different activities. I decided to measure how it influenced my productivity levels because I am always looks for new ways to be more efficient when doing my work. I feel like I can be easily distracted so I think that this activity helped me process what I should and should not be doing when completing certain homework. I think that if I were to do this activity again in the future I would be sure to include how working around others while listening to music influences my productivity as well. One thing I regret not including was how productive I felt when listening to no music at all. I think that I sometimes need the headphones to help focus in on what I am doing and other times I use the music was an excuse to go on my phone. Overall, I believe that this activity was a valuable tool for self analysis and I would be interested to see the other things I could potentially measure in my life in the future.